Manufacturing Forecasting Guide for SMEs
Next to forecasting customer demand, aligning production capacity with anticipated sales is the stuff of manufacturing forecasting. In this blog post, we go over production forecasting essentials, look at how to implement a forecasting system, and see the role manufacturing software can play in ensuring that the shop floor is aligned with forecasted sales numbers.

What is manufacturing forecasting?
Manufacturing forecasting, or production forecasting, is the process of aligning forecasted demand with production output as precisely as possible. It’s a systematic part of demand planning that attempts to predict production requirements for manufactured goods in order to optimize production schedules, resource allocation, and shop floor efficiency.
Like demand forecasting, which predicts customer demand for products, manufacturing forecasting relies on high-quality data to predict production requirements. Data from various sources is used, such as historical production rates, supply chain and procurement data, production scheduling insights, lead times, and inventory levels. This data is analyzed using qualitative and quantitative forecasting methods to make reliable predictions for optimizing production plans.
So whereas demand forecasts predict what customers want, manufacturing forecasts predict what to produce, when, and in what quantities, to satisfy that demand.
Production forecasting vs demand planning?
Demand planning is the overall business process of determining the market requirements of products to ensure a company can cost-effectively meet customer demand. It aims to provide the right product at the right time and place while minimizing excess and stockouts. Demand planning is very much a team sport. It is determined by cross-functional teams that align production requirements with marketing, sales, and finance inputs to adjust production volumes for promotions, new product launches, or market changes.
Production forecasting is the tactical subset of this process that uses inputs from demand plans to predict production requirements.
Production-based vs sales-data forecasts
While demand forecasting starts with sales data, manufacturing forecasting is usually driven by production-based insights. Sales-data forecasts use historical and current sales trends to predict future demand, which is especially useful for market-facing decisions and inventory planning. Production-based forecasts, on the other hand, are built on internal metrics such as historical production rates, machine capacity, labor availability, and material lead times. They help manufacturers identify realistic production outputs, anticipate bottlenecks, plan maintenance schedules, etc.
Realistically, manufacturing forecasts blend both approaches. They use sales trends to estimate and plan outputs and production data to determine how best to meet them.
Forecasting in push vs pull systems
Forecasting production requirements depends heavily on the manufacturing industry and setup. Key differences lie in whether a business has a make-to-stock (MTS) production model, which creates goods based on a push system, or a make-to-order (MTO) model, in which only real demand for products in the form of incoming sales orders drives production.
In push systems, manufacturers rely most on market demand forecasts to understand projected sales volumes. Since production volumes are preset based on these forecasts, production capacities must be planned meticulously. But they still need to maintain flexibility in production planning, adjust quickly to unexpected demand changes, and keep safety stock for critical items.
In pull systems, however, demand is real, and nothing save for critical safety stock is produced ahead of incoming orders. But this doesn’t mean that forecasting is unnecessary. MTO manufacturers still need to know how long it takes supplies to reach the shop floor, what the projected production capacities of the factory are in case of larger orders, or which SKUs (stock keeping units) need to be prioritized.
In short, push systems rely heavily on accurate demand forecasting to understand how much needs to be produced by when, whereas pull systems rely more on production forecasting to gain insights on capacity constraints, lead time requirements, and resource allocation to ensure timely delivery without overburdening the production process.
Continue reading about push vs pull systems in manufacturing.
The importance of manufacturing forecasting
Manufacturing forecasting isn’t about guessing customers’ preferences for a given period – that’s sales forecast territory. It’s about turning anticipated demand into realistic and attainable production plans. For SMEs who often need to juggle tight margins, this can mean the difference between profit and loss due to fewer delays, less waste, and a smoother shop floor.
Realistic production schedules
A good forecast turns sales expectations into achievable output targets. It factors in machine capacity, shift patterns, and maintenance windows so sales teams don’t promise what you can’t deliver. When schedules match reality, the shop floor runs on time and workers aren’t stuck rushing orders or idling between jobs. It also means orders leave the factory when they should, contributing to customer satisfaction.
Ensuring resource availability
Production stalls when materials, tools, or people aren’t where they need to be. Production forecasting gives manufacturers a heads-up on what resources will be needed and when, so procurement can put in orders in time and HR can staff shifts properly. It can be the difference between staying on time and losing time waiting for missing parts.
Keeping inventory optimized
Production forecasting helps you keep the right amount of raw materials, WIP, and finished goods on hand. Too much ties up cash and clogs storage. Too little risks delays and missed deliveries.
By linking your production plan with actual capacity and lead times, you can set realistic reorder points and avoid panic restocking. The result is a smoother flow of materials through the factory and fewer surprises in the warehouse.
Managing lead times and bottlenecks
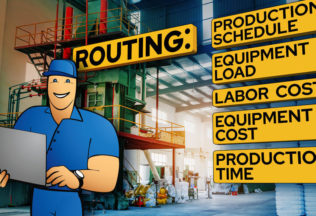
Every factory has constraints — the slowest machine in a product’s routing, a long lead time for a supply, or a tricky assembly. Production forecasts help you spot where on the shop floor these will occur and provide contingency plans for when they do. Stuff like helping to adjust production schedules, resequence work, or build key subassemblies early to keep output flowing.
Keeping production costs in check
Production forecasts make life easier for the finance team, too. They help predict production costs, inform better procurement timing, and plan the budget accordingly. Knowing what you need to produce and by when helps reduce overtime, order materials in optimal quantities, and avoid rush fees. Over time, that means a steadier cash flow and healthier margins without cutting corners on output.
Safeguarding against supply chain disruptions
Even the best plan gets tested by reality. A supplier misses a delivery. A big order drops at the last minute. Solid forecasting gives you the visibility to adapt to surprises without throwing the schedule off. You can shift capacity, pull forward certain jobs, or run overtime strategically — instead of fighting fires every time something goes wrong.
Vital data sources for production forecasts
Before building a production forecast, manufacturers need to gather the right inputs. The quality and variety of your data will determine the accuracy and applicability of your forecast. Strong forecasts pull from different sources to paint a comprehensive picture of both demand, capacity, and constraints.
Historical data
Past production records provide the foundation for most forecasts. Looking at how much you produced, how long it took, and what resources were required helps identify realistic capacity limits and highlight areas for improvement. Data points such as historical output volumes, machine utilization, scrap rates, and labor hours help highlight trends that are likely to continue.
Seasonality and market constraints
Many manufacturing sectors see predictable shifts in demand tied to seasons, holidays, or industry cycles. Factoring in these fluctuations allows you to ramp production up or down at the right times. Shifting market conditions and other external constraints, like regulatory deadlines or scheduled product launches, must also be considered to avoid last-minute pressure on production.
Supply chain data
Even the best demand forecast can fall apart if materials arrive late or inconsistently. Lead times, supplier performance records, and shipping durations should all be tracked as well. This ensures your production forecast is grounded in what’s possible given the timing and reliability of your supply chain.
Implementing manufacturing forecasts
So, how to turn all that raw data into an actionable production forecast? The process involves several steps, from cleaning the data to selecting a method and continuously refining your approach.
1. Identify and clean the data
This is the groundwork for any accurate forecast. Start by gathering and disseminating relevant data from production logs, inventory records, sales orders, and supplier reports. Check that measurements are consistent, for example, that all quantities are in the same units and time periods. Then, clean the data by removing duplicate records and correcting obvious mistakes like incorrect dates or unrealistic quantities. Next, fill in missing data where possible, either by consulting source documents or people involved, or by using reasonable estimates. Tag unusual events, such as strike weeks or urgent one-off orders, so they can be excluded or treated separately during analysis. It goes without saying – the cleaner and more consistent your data, the more reliable your forecast will be.
2. Analyze the data
Once the data is clean, take time to truly understand what it’s telling you. Look for recurring patterns that may point to steady, seasonal, or highly variable demand. Identify which products are your consistent top movers and which have unpredictable spikes. Compare demand patterns against production capacity to see where bottlenecks could occur. Watch for anomalies like sudden drops in production or unexpected surges, and investigate the cause. By mapping these insights, you can match the right forecasting method to each product category and anticipate where flexibility or extra capacity might be needed.
3. Choose a forecasting method
Manufacturers have a variety of forecasting methods at their disposal. The choice depends on the type of demand pattern, available data, and required level of accuracy. In practice, many manufacturers test several methods and compare their accuracy before deciding which to adopt. The aim is to choose a method that delivers reliable results without adding unnecessary complexity for the team.
Here are some standard methods:
- For straightforward, stable demand, moving averages can smooth out short-term fluctuations.
- Exponential smoothing adds more weight to recent data, making it suitable when recent trends are more relevant.
- ARIMA (Autoregressive Integrated Moving Average) models are a more advanced method, useful when you need to account for both trends and seasonality in a structured way.
- The Croston’s method is often the go-to for items with intermittent demand. It involves exponential smoothing the data, followed by determining demand intervals within it.
- For new products without much history, consider utilizing analogue methods based on similar products.
4. Pick the right forecasting tool
Your chosen tool will directly impact how easy it is to create, maintain, and share your forecasts and integrate them with your other systems. For many SMEs, this may mean starting with spreadsheet-based templates that are easy to export into your ERP or MRP system. Larger operations often benefit from advanced planning and scheduling (APS) systems with built-in forecasting modules.
The right tool should fit your scale, budget, and workflow, making forecasting a routine, not a burden. Look for features like:
- Integration with your manufacturing ERP or MRP system so that data flows automatically.
- Scenario planning to model “what-if” situations such as sudden demand spikes or supply delays.
- Collaboration options so multiple departments, from procurement to sales, can contribute and view real-time updates.
- Accuracy tracking to compare forecasts with actual results and make improvements.
5. Check against actual production efforts
Once the forecast is in place, track how well it matches your actual production effort. Regularly reviewing differences between forecasted and actual output helps you fine-tune your methods and improve accuracy. Compare forecasted vs. actual starts/finishes by SKU or workstation monthly and monitor forecast accuracy to re-tune any parameter inconsistencies.
Production forecasting models
Forecasting models are the specific techniques that turn raw data into predictions of future production needs. Each model has its strengths and limitations, and choosing the right one depends on the nature of your products, demand patterns, and available data. In many cases, manufacturers use a combination of models to improve accuracy.
Trend projection
This is one of the simplest models. It projects past performance insights into the future using a basic linear trend. It works well when production output has been stable and changes happen gradually over time. For example, if you’ve consistently increased output by 2% per quarter, trend projection can give a quick, easy estimate of future production needs.
Time-series models
These types of models analyze data collected at regular intervals, like daily production timestamps input by shop floor workers, or weekly data alignments by production managers. They help identify patterns like trends, seasonality, or cyclical fluctuations. As noted above, popular examples include simple moving averages, which smooth out short-term variations, or the Holt-Winters exponential smoothing method, which can capture trend and seasonal effects together. More advanced approaches like ARIMA add statistical analysis to make sense of more complex yet consistent patterns.
Historical similarities
Sometimes called analogue forecasting, this model bases future predictions on the performance of similar products or comparable time periods. For instance, if a new product is similar to one launched last year, you can use its historical data as a guideline. This approach is particularly useful for new product introductions or market expansions where there’s little direct history to go on.
Causal models
Causal models approach forecasting differently by linking demand forecasts to influencing factors such as pricing, marketing campaigns, economic indicators, or even weather patterns. For example, a manufacturer of seasonal equipment might use a causal model to make an informed decision based on historical temperature data. Causal models can be as simple as linear regression or as complex as multivariate statistical analyses. Still, their defining feature is that they incorporate outside drivers rather than relying solely on analyzing demand.
Qualitative methods
When reliable historical data is scarce, qualitative methods step in. These rely on informed judgment from experts, sales teams, suppliers, or even customers. Techniques include the Delphi method, also known as the Estimate-Talk-Estimate method, where a panel of experts is tasked with iteratively refining forecasts. Another option is CPFR (Collaborative Planning, Forecasting, and Replenishment), in which supply chain partners share their insights with manufacturers to plan procurements and optimize inventories. Although these are more subjective, qualitative methods can capture market intelligence and external factors that raw data may miss and are often used in line with statistical methods.

Main challenges in manufacturing forecasting
Forecasting is one of those regimes that attempts to predict the future while being a precise science. Manufacturing forecasting is no different, and challenges are commonplace. Here are seven common production forecasting hurdles and tips to address them.
Data gaps and fragmentation
When data is scattered across spreadsheets and inboxes, inconsistencies are a given. Units get mismatched, timestamps go missing, and duplicates happen. Bad data equals unstable plans and falling confidence in the numbers. To remedy this, standardize data definitions and production calendars, consolidate sources into your ERP/MRP system, and flag one-off events like rush orders, so they don’t distort patterns. A short data‑quality review should be a standing step before refreshing your forecasts.
Intermittent or spiking demand
Long stretches of low demand punctuated by sudden spikes are a common sight with certain products, such as niche SKUs or project items. Averages may look acceptable, but the service levels fluctuate. Apply methods designed for intermittent demand, like Croston‑type approaches, or manage these items separately with service‑level‑based buffers or reorder points. Revisit their minimum order quantities (MOQs) and lead times to make replenishment quantities and timing more workable.
Long and variable lead times
Quoted lead times rarely match real variability. Slippage in incoming materials often cascades into missed starts, overtime, and expediting. This is why traceability is so critical in the modern supply chain. To overcome lead time uncertainty, plan with observed lead times rather than quoted values. Also, add safety time and safety stock for critical components, qualify alternate suppliers or products where feasible, and protect the near term with a short schedule “freeze window” in your master production schedule (MPS).
Capacity constraints and changeovers
Plans that assume you’re working with infinite production capacity tend to ignore setup times, maintenance windows, and bottlenecks. Execution then inevitably diverges from the plan. Translate demand into machine hours by workstation, sequence your product families to reduce changeovers, and level workloads across shifts. Put your preventive maintenance on the same calendar as your production orders, so it actually happens.
New products and low-history items
New or slow‑moving items don’t provide much data to learn from. This can make your forecasts easy to over‑ or undershoot. The goal here is to start simple and learn quickly. Use the closest comparable SKU or product family that has viable data as a baseline and review the results more frequently at first. Adjust the plan based on actual orders and shop‑floor feedback. Keep the products’ initial batches modest and align purchasing to shorter horizons, letting the forecast mature as real data comes in.
Bullwhip and amplified volatility
Small downstream demand changes can become large upstream swings when orders batch up, review cycles are long, or data is stale. This is called the bullwhip effect, and left alone, it can create a lot of instability. To remedy it, shorten review cycles, reduce order batching, and share downstream demand signals with suppliers, utilizing the CPFR method. Lightweight collaborative planning with key accounts can significantly reduce variability across the supply chain.
Measuring accuracy and bias
Forecast accuracy shows how close the plan was to reality. Forecast bias shows whether you systematically over‑ or under-plan the production capacities. Both of these are crucial metrics that inform your forecasting efficiency. To start boosting your forecast accuracy, track a small, consistent set of KPIs so everyone reads results the same way:
- WAPE (or MAPE) (Weighted/Mean Absolute Percentage Error). This returns a simple error percentage to gauge how far off your target you were.
- Bias. The average value between your forecast vs. actual numbers. If it’s positive, you’re over‑forecasting, and negative means you’re under‑forecasting.
- Drift check (tracking signal). This essential forecasting KPI helps spot systematic issues, flagging situations when errors keep leaning one way.
Review the KPI results monthly at the SKU or product‑family level and also for totals. If bias leans one way for a few months, adjust your method or parameters and check again. When you add a manual step or extra input, do a quick before/after check (also called a Forecast Value Added check) to see which events (manual overrides, promotions, supplier inputs, etc.) actually improved the forecast. Keep what helps, streamline what doesn’t, and don’t forget to feed lessons learned into the next cycle.
Elevate forecasting accuracy with manufacturing ERP
A modern manufacturing ERP software can be a big help in facilitating the forecasting process. It helps gather and unify historical sales data and tracks every step of the production process, inventory levels, and purchasing history. The result is faster access to business-critical information, plans that respond to market trends, and less risk of overproduction or overstocking.
Unified data & full traceability
Manufacturing software creates a single source of truth for all your orders, BOMs and routings, stock levels, supplier lead times, and production calendars. When everyone works with the same real-time data and on the same timeline, fragmentation and human errors are significantly reduced.
The end‑to‑end traceability of these systems helps link finished items to their stock lots, operations, and costs, letting you quickly check assumptions and understand how changes ripple through the product life cycle or how they affect your margins.
Production planning and execution
Production planning connects your forecasts with day‑to‑day operations. Manufacturing resource planning (MRP) keeps inventory and procurements in step with expected builds, proposing purchases for items that will be short, respecting supplier lead times and MOQs, and having alternates ready for when supply is tight. On the floor, planners can release production orders, track progress, and record consumption and yields. Issues like late components, capacity conflicts, or quality holds are flagged early so schedules can be adjusted before deadlines are missed.
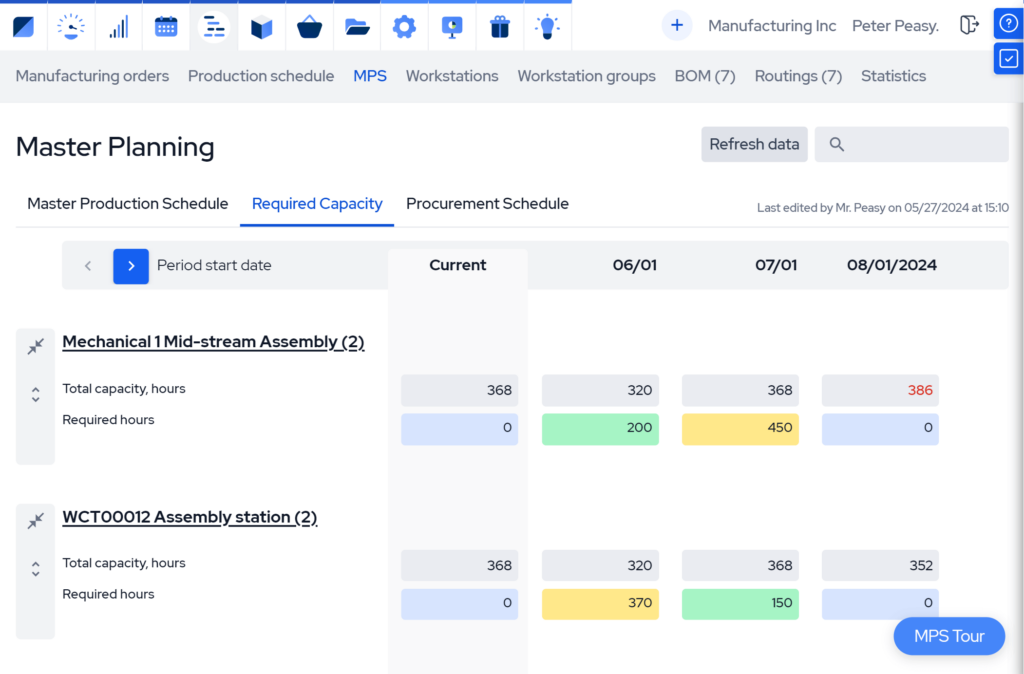
Master production scheduling
Master production scheduling (MPS) turns the forecast and firm customer orders into a time‑phased, makeable plan. It checks work‑center loads, changeovers, and maintenance windows, and protects the near term with a short schedule “freeze window.” Simple what‑if scenarios let you compare options before committing. By aligning demand with realistic capacity, the MPS helps prevent shortages and avoid overproduction and the carrying costs that follow.
Measure, learn, and integrate
ERP systems have built-in performance dashboards that help track production metrics like workstation efficiency and capacity utilization. Datasets are easy to export and publish to visualization tools like MS Power BI for deeper analysis. Built-in integrations with workflow automation apps or even access to an API for custom builds enable connecting with an APS when advanced analytics and constraint optimization are required. All this makes ERPs an excellent tool for forecasting, helping to make the process repeatable, actionable, and easy to build on.
MRPeasy – forecasting made practical
MRPeasy brings all of these tools and more together for small and medium-sized manufacturers and distributors. It provides unified data, a built-in MPS, and class-leading manufacturing resource planning to turn forecasts into buy‑and‑make proposals, finite scheduling by workstation, and clear dashboards for visibility and accuracy. The outcome is confidence in production schedules, fewer surprises, and a lower risk of excess inventory or missed orders.
Key takeaways
- Manufacturing forecasting is a data-driven process for aligning forecasted demand with production output to create realistic schedules, allocate resources, and prevent overproduction and excess inventory.
- Strong forecasts combine historical sales data, shop-floor history, supplier lead times, and market trends so decision-making reflects real capacity and supply constraints.
- The forecasting process works best when data is cleaned and standardized, patterns are analyzed, and results are checked against actuals to steadily improve accuracy and reduce bias.
- Methods should fit the signal: moving averages and exponential smoothing for stable items, Holt–Winters/ARIMA for trend and seasonality, and Croston‑type for intermittent demand—supplemented by qualitative input when history is thin.
- A robust manufacturing ERP simplifies the forecasting process by unifying key data, enabling end‑to‑end traceability, providing easy access to performance metrics, and integrating easily with APS or external analytics tools.
Frequently asked questions (FAQ)
Define the unit and scope (SKU/location and time horizon). Collect and clean historical sales, production, lead‑time, and inventory data. Analyze patterns like level, trend, seasonality, or intermittency. Choose a suitable method and tool for forecasting. Build the forecast, validate on holdout data, and review vs. actuals on a regular basis.
There is no one “best” manufacturing forecasting method because methods depend on the signal or source data. For stable items, moving average or simple/exponential smoothing works well. For trend or seasonal items, Holt–Winters or ARIMA are strong choices. For intermittent demand, use Croston‑type methods. When data is thin or changes are underway, pair statistics with team and supplier inputs.
Typically, small manufacturers should update forecasts monthly so that plans track reality, although this depends on the nature of the production. In more volatile settings or for high‑value A items, and after major changes like big orders, price shifts, or supplier delays, even weekly refreshes make sense.
You might also like: Production Planning with Excel – Opportunities and Limitations