Root Cause Analysis in Manufacturing: What is RCA and How to Do it?
It’s great when production runs smoothly. However, when problems arise, SMEs must delve deeper than surface symptoms and conduct a root cause analysis. Without identifying the underlying causes of failure, you’re trapped endlessly in putting out fires, wasting time and money on temporary fixes.

What is root cause analysis?
Root cause analysis (RCA) is a systematic approach to analyzing failures anywhere in the production process to identify root causes or drivers and prevent recurrence. It can also be used for other purposes, such as safety and human resources staffing, along with other business processes. I’ve used it for machine troubleshooting as an electrician and maintenance tech. But we’ll concentrate on using it to discover the root cause of problems found in the manufacturing process.
RCA is not a single method, but an umbrella term for various techniques and models. Having participated in many root cause analyses, I must mention that RCA isn’t playing the blame game. Remember, you’re looking for the true root cause, not finding fault nor finger-pointing. Stay as neutral as possible in your investigation.
Root cause versus surface-level problems
Imagine there’s a leak flooding your warehouse floor. One option is to keep mopping the floor. But the leak still persists. You haven’t solved the problem. It is still an ongoing recurrence.
A root cause analysis would track the issue back to its source, a leaky pipe three rooms away. The water on the floor was the symptom—the leaky pipe is the root cause. Perhaps it was, in turn, caused by poor maintenance scheduling.
Here’s an example in manufacturing:
- Symptom: Late customer deliveries.
- Surface cause: Shipping delays.
- Deeper cause: Production runs behind schedule.
- Deeper still: Material shortages.
- Root cause: Inaccurate inventory tracking system.
Why addressing root cause matters in manufacturing
Recurring problems waste time, materials, and money. Temporary fixes made without finding the true root cause of a problem create cascading failures.
Most manufacturers recognize symptoms quickly, but struggle to stop them from recurring. Here are three manufacturing goals of performing RCA.
Goal 1: Identify the true problem source
The first goal is going beyond visible symptoms to find what’s actually broken. RCA uses systematic, data-driven methods to trace problems back to their point of origin, helping distinguish between contributing factors and the real source or deficiency that’s driving the issue.
For example, late deliveries aren’t always a shipping problem. They’re usually an inventory, planning, or communication breakdown several steps earlier in the process. Or it could be something else. Driving down to the core issue is a must.
Goal 2: Implement solutions that really work
Once you’re no longer treating symptoms because you’ve drilled down to the actual root cause, you’re now able to generate corrective actions based on reality rather than assumptions. This targets the actual breakdown point to make certain your solutions stick.
When you address root causes, you create data-backed solutions that deliver lasting results, not temporary relief.
Goal 3: Stop problems from recurring
The whole point is to tackle the real root cause so you’re not stuck in an endless cycle of recurring problems. Making targeted improvements builds system reliability. You finally stop chasing the same problems over and over.
This shifts your operation from reactive stop-gap mode to proactive problem prevention. You’re addressing the actual underlying issues and promoting quality management and control of your manufacturing and business processes.
There’s a compound benefit. Each root cause you eliminate strengthens your entire operation, creating momentum for continuous improvement and providing more value for your stakeholders.
How to perform root cause analysis
There are several effective root cause analysis templates recognized for diagramming root cause analysis. They can range from simple to complex. But for any of them to be effective, you need to follow a well-defined pattern.
One structured pattern from continuous improvement and Six Sigma is the five-phase methodology DMAIC – Define, Measure, Analyze, Improve, Control. It can be used for designing new processes as well as root cause analysis.
Phase 1: Define
First, figure out if you actually have a problem in your process. Use your production standards as a guide. If it really is a problem, write out exactly what’s wrong in plain language that everyone understands.
Then bring your RCA team together and share the problem statement. Make sure everyone agrees with your findings.
Phase 2: Measure
Gather up and analyze any records that are pertinent to the issue. You’re ready to start an in-depth analysis. Your RCA team should agree on what data to collect and where to find it.
For example, investigating failed quality assurance tests on furniture finishes may begin with spray equipment maintenance records or stain expiration dates.
Look for patterns, the frequency of fault conditions, and the impact they have on operations. Identify what areas or manufacturing procedures are affected.
Phase 3: Analyze
Using the data collected, brainstorm ideas for identifying actual causes. Be sure to include the team members who will be familiar with and understand the data or records. It’s also good to get a second pair of “outsider” eyes to view the records. They can often ask questions or make observations that your RCA team may have missed.
As you analyze the data, separate the warning signs or symptoms from authentic root causes. A fever doesn’t tell a doctor what’s wrong. They evaluate and test and evaluate again to find the real issue before recommending treatment. Your problem-solving process is similar. Never jump to premature conclusions. Make sure you understand what’s really going on.
Using the appropriate RCA design template, list all of the possible causes. Test and validate each one to see if they really are the root cause. My favorite method is the 5 Whys methodology, which we’ll get to in a minute.
When you’ve drilled down through the potential causes and dismissed the symptoms, the one left will be your root cause. Be sure to avoid any premature conclusions before you move to step 5. It’s also likely that there are multiple root causes.
Phase 4: Improve
Now that you know what’s causing the problem, get to work on fixing it. Some solutions are quick wins. Others need more heavy lifting. Design something that your team can actually put into practice. It must be sustainable. It must hold up over time. You may need to experiment with different solutions to find the one that works best.
Then get specific. Who owns what portion of the fix, and when will it realistically be done? Without clear accountability, even the best plans end up collecting dust.
Phase 5: Control
Solution implemented? Now prove it’s working. Establish clear success metrics. Monitor them consistently. The monitoring period will vary depending on the remedy. You’ll need to consider the problem’s impact. Make sure the fix is being applied consistently.
Determine who’s involved in the fix. If third parties are involved, they should be included. A quick internal fix might need a month of tracking. But a complex issue touching multiple areas or external partners? Plan for longer-term monitoring. Tracking an in-house challenge usually takes less time than monitoring problems coming from outside sources.
And finally – what if the problem doesn’t go away? You start again at square one and see what you missed. Revisit your original RCA and see what was missed or dismissed. Then begin the entire process over again.
RCA tools and methods
The same RCA model or approach cannot be used for every root cause analysis. The right method for the job depends on:
- The nature of your problem.
- Its complexity.
- The resources at your disposal.
Sometimes you’ll start with one approach and switch to another as you learn more. For example, the 5 Whys might reveal multiple contributing factors, leading you to create a Fishbone diagram. Change Analysis might point you toward a specific failure that needs Fault Tree Analysis. The key is starting with the method that initially matches your problem, and then adapting your analysis method as needed.
Here’s how to match the right tool to your situation.
RCA models for simple, linear problems
Straightforward cause-and-effect relationships usually don’t need complex analysis tools. These methods work when the problem has a clear progression. One thing leads to another in a fairly direct path.
The 5 Whys
What it is: A question/answer technique that drills down to the root cause by repeatedly asking “why” until you reach the fundamental issue.
Best for: Uncomplicated problems with direct cause-and-effect relationships. It’s great when you need quick answers without requiring extensive data collection for decision-making. The five whys will help you find the causal factor relatively quickly.
How it works:
- Start by clearly stating the problem as simply as possible.
- Ask “why” the problem occurred. Be sure to document the answer.
- Take that answer and ask why again.
- Continue asking why (typically 4-6 times) until further answers don’t make sense or provide any additional useful information.
Example:
- Problem: Customer deliveries are consistently late.
- Why? Production finishes behind schedule.
- Why? Raw materials create stockouts unexpectedly.
- Why? Inventory levels don’t line up with what’s in the system.
- Why? Material consumption isn’t being reported correctly.
- Why? New employees don’t understand the reporting process.
- Root cause: Inadequate training on inventory reporting procedures.
Watch out for: Don’t stop too early. It’s tempting to accept the first reasonable answer, but that’s usually just a symptom. It may not be the true root cause. Also, be careful not to turn this into a blame game. Focus on process failures, not just human error.
Change Analysis
What it is: A method that examines what changed in your process, environment, or materials before the problem started occurring.
Best for: Problems that appeared suddenly or recently. This happens particularly when you hear workers say, “Everything was working fine until…”
How it works:
- Establish exactly when the problem first appeared, or as close as possible.
- Identify all changes that occurred around that time, such as personnel changes, materials from new vendors, equipment adjustments, or procedure updates.
- Analyze each change. Determine if it could have contributed to the problem.
- Test your hypothesis by examining its correlation to the issue.
- Verify by seeing if reversing the change eliminates the problem.
Example:
- Problem: Quality defects spiked two weeks ago.
- Changes identified: 1. There is a new supplier for a critical component, 2. We have made operator shift changes, and 3. There was a recent software update.
- Investigation reveals the new supplier’s component has slightly different specifications.
- Root cause: Component specification mismatch from supplier change.
Watch out for: Multiple changes often happen simultaneously. Don’t assume the most obvious change is the culprit or the only issue—investigate all possibilities systematically.
RCA for multi-factor problems
Sometimes a problem doesn’t have just one cause. It’s a perfect storm of several things going wrong at the same time. When you have multiple suspects or are honestly not sure where to start, you need something that helps you map out all the possibilities.
This is exactly where the fishbone diagram shines.
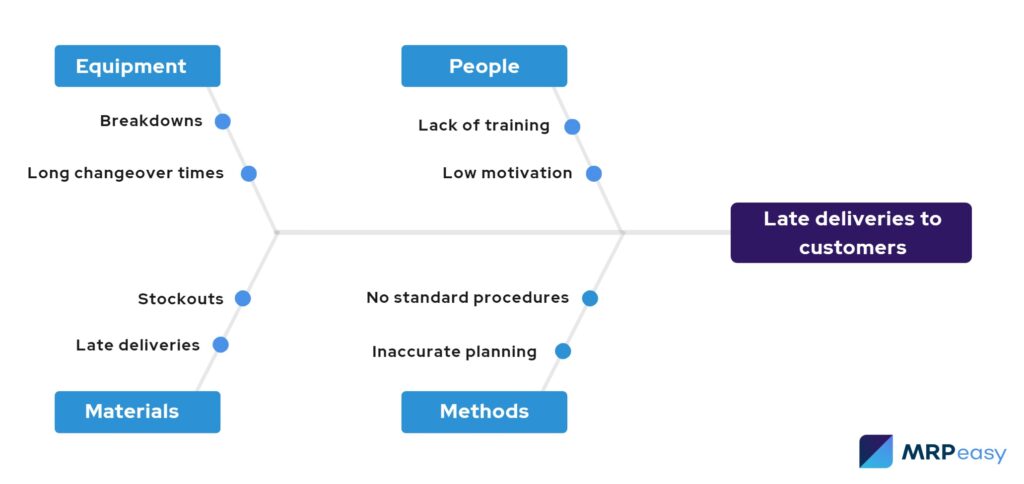
Fishbone or Ishikawa diagram
What it is: A visual brainstorming tool that organizes potential causes into categories. It visibly shows how each might contribute to a problem. It resembles a fish skeleton when drawn out.
Best for: Complex problems with multiple potential causes. It’s also great for situations where you need to explore all possibilities before narrowing them down.
How it works:
- Draw a horizontal line with the problem statement in a box at the right end (the “fish’s head”).
- Identify 4-6 major categories that could contain causes for inefficiencies. For manufacturing, it could include:
- Manpower.
- Method.
- Materials
- Machinery.
- Measurement.
- Environment.
- Draw diagonal lines off the main line for each category (the “bones” of the skeleton).
- Brainstorm potential root causes within each category. Add them as smaller branches.
- Analyze the diagram. Identify the most likely root causes for further examination.
Example:
- Problem: High defect rates in final assembly.
- Categories and branch issues to explore:
- Manpower → Training gaps or fatigue.
- Method → Unclear procedures or ad hoc shortcuts.
- Materials → Quality variations or wrong specifications.
- Machinery → Calibration issues or worn tooling.
- Your investigation identifies worn tooling as the primary contributor.
- Root cause: Inefficiencies in preventive maintenance scheduling or retooling.
Watch out for: Think of the fishbone chart as your starting point. It brings up potential causes, but you’ll need to validate each one. During your brainstorming session, resist the urge to wander into peripheral issues. Stay centered on the specific problem you’re addressing.
RCA methods for complex or safety-critical problems
When you’re dealing with problems that have multiple failure points, safety risks, or complex systems, you need heavier-duty tools. These methods help you trace how failures happen and figure out where your safety nets failed. One thing breaking can often trigger a domino effect.
Fault Tree Analysis
What it is: A top-down, logic diagram that maps out all the possible ways a failure could occur, using logic gates to show relationships between events. It often looks like a tree.
Best for: Complex problems with multiple potential failure paths, safety-critical incidents, or when you need to understand how various failures combine to create a problem.
How it works:
- Define the undesired event and place it at the top of the tree.
- Identify any immediate causes that could lead to this issue.
- For each cause, determine if it’s a basic event that can’t be broken down further or requires further analysis.
- Use AND/OR logic gates to show how events combine or relate.
- Trace all paths from top to bottom. This will identify which combinations of failures led to the problem.
Example:
- Problem: A critical equipment failure resulted in a production stoppage.
- Analysis reveals multiple contributing factors:
- Sensor malfunctions were not caught because the maintenance schedule was skipped.
- Safety protocols were overridden because the alarm had been disabled due to previous false alarms.
- The operator didn’t notice the warning signs due to inadequate training.
- Root causes: In this case, there were multiple failures, including maintenance gaps, safety protocol violations, and training deficiencies.
Watch out for: This method can get complicated in a heartbeat. Keep your fault tree focused on the specific incident that occurred. Don’t try to map every possible failure scenario. It’s more analytical than other methods. It works best when you have decent documentation of what happened.
Barrier Analysis
What it is: This is a method that identifies what barriers or safeguards were supposed to prevent a problem. It analyzes why they failed.
Best for: Quality failures, safety incidents, health care situations where something that should have been caught wasn’t. Multiple safety systems may have failed.
How it works:
- Identify the hazard or defect that occurred.
- Map out all the barriers that were supposed to prevent it. Some examples are inspections, quality checks, safety procedures.
- Trace the path the problem took and identify which barriers failed.
- For each failed barrier, determine why it didn’t work. Was it absent, inadequate, or not followed?.
- Determine which barrier failure was the most critical.
Example:
- Problem: A defective product reached the customer.
- Barriers that should have caught it:
- In-process inspection was skipped due to time pressure.
- The final quality check was in error. The inspector was new and missed the defect.
- Customer acceptance testing. A customer didn’t test this feature before ordering it.
- Root cause: Quality control process has inadequate safeguards when production is rushed, and training for inspectors is insufficient.
Watch out for: Finding that a barrier failed doesn’t mean you’ve found the root cause. You need to understand why the barrier failed. Was it poorly designed? Not followed? Disabled? That’s where the real awareness lies.

The benefits and challenges of root cause analysis
Root cause analysis delivers real value. But it’s not without its complications. Here’s what you need to know about both sides and how to navigate the challenges.
Permanent problem resolution
The biggest benefit of RCA is solving problems once and for all. When you eliminate the underlying cause, you stop the recurrence of rework and repeated fixes. But here’s the challenge: it takes more time upfront than a quick fix.
The solution? Start with problems that are costing you the most in time or money. The ROI justifies the time and effort put in.
Measurable cost savings
Manufacturers who implement RCA consistently see reductions in scrap, rework, and downtime. Some SMEs report improvements in on-time delivery rates after systematically addressing root causes. The challenge is that you need data to track these improvements. Many small manufacturers don’t have robust process data tracking systems in place.
The solution? Start simple. Track just one or two key metrics like defect rates or customer complaints so you can prove the value as you go.
Stronger team capabilities
RCA builds problem-solving skills across your entire organization. Your team learns to think critically and systematically about issues. The challenge? You may face pushback from people who think it’s a waste of time. Some are uncomfortable with the scrutiny.
The solution? Frame it as process improvement, not blame-finding. Praise your wins publicly and involve those who resisted in the process. People support what they help create.
Better customer relationships
When you eliminate recurring quality issues and delivery problems, customers notice. Reliability becomes your competitive advantage. The challenge is that customers don’t see the internal work you’re doing. They just see the end results or lack thereof.
The solution? Don’t wait until everything’s perfect. Tell customers when you’ve identified and fixed a root cause that affected them. It builds trust.
Organizational knowledge and continuous improvement
Every RCA session adds to your company’s knowledge base. Over time, you build an institutional library about what works and what doesn’t. The challenge? Knowledge walks out the door when people leave. Busy teams rarely document what they’ve learned without prompting.
The solution? Create a simple RCA log or shared folder where findings and solutions are captured. It doesn’t need to be fancy. Even a simple spreadsheet works.
The resource reality
RCA requires time, and small manufacturers always feel short on time. You’re already stretched thin, and now someone’s asking you to slow down and analyze problems? The challenge is real.
But so is the time you spend dealing with the same recurring problems. It’s time you’re already losing. RCA redirects that time toward permanent solutions. It’s an investment that pays dividends once the habit takes hold.
7 RCA tips for small manufacturers
- Start with high-impact problems. Don’t try to solve everything at once. That’s nearly impossible. But be on the lookout for problems and start a root cause analysis ASAP. Focus on issues affecting quality, safety, or major costs.
- Involve the people closest to the problem. Remember, floor workers and operators often have valuable insights. They literally live with the manufacturing process. Create a safe environment for honest input. Assure them you’re not there to lay blame, but to solve issues.
- Document your findings and solutions. Build organizational knowledge by creating a reference library of past RCAs. Many organizations file them away or forget them. What you solve today may streamline the RCA process in the future.
- Don’t stop at the first “why” and think you’re done. Push deeper even when you think you have the answer. While you’re at it, watch for multiple root causes that are initiating issues in other areas of your process.
- Focus on process and system issues, not finding blame. While it’s easy to blame people, and many instructors teach that human error is rampant, root causes are usually process failures, not people failures. If you create a no-blame culture, your employees are more compelled to help solve issues. Many take pride in their work. Take advantage of that.
- Implement sustainable solutions, not quick fixes. Make sure solutions are practical and maintainable. Consider long-term consequences. Make sure your solution for one problem doesn’t create other issues. That happens often. I’ve seen it myself.
- Follow through and verify every solution. Don’t assume the solution worked. Prove it through proper monitoring. That monitoring period may take days, but it could take weeks and even months. This is not a “set it and forget it” procedure. Make monitoring part of your standard process. Make sure your analysis is data-driven, not based on conjecture.
Manufacturing ERPs: Better data means better root cause analysis
When you’re trying to solve manufacturing problems, you need precise, easily accessible information. A quality manufacturing ERP software tracks everything from materials and production to quality and delivery. That means when issues arise, you have the data you need to find root causes faster, at your fingertips. And the monitoring tools to verify your solutions work.
Even better, many manufacturers find that having this level of visibility helps prevent issues before they require root cause analysis.
- Real-time inventory tracking stops material shortages before they delay production.
- Automated alerts catch quality issues before they reach customers.
- Clear production scheduling eliminates any confusion that leads to missed deadlines.
Because when your data is accurate and accessible, you’re not just better at solving problems. You’re creating fewer of them in the first place.
Key takeaways
- Root cause analysis (RCA) is a structured method for identifying the true origins of process failures and looking past symptoms. It helps manufacturers eliminate recurring issues instead of repeatedly reacting to the same problems.
- Using a process framework like DMAIC (define, measure, analyze, improve, control) adds structure and consistency to root cause investigations. Defining the problem clearly, collecting the right data, and analyzing it methodically reduces the risk of jumping to conclusions or overlooking critical details.
- Different types of issues require different RCA tools. Simple problems may only need the 5 Whys, while multifactor or safety-sensitive situations benefit from tools like Fishbone diagrams, Fault Tree Analysis, or Barrier Analysis. Choosing the right model keeps the process efficient and ensures the required level of scrutiny.
- When it becomes a standard practice, RCA brings manufacturers long-term benefits. It helps lower costs, improve process reliability, and strengthen team capabilities. Documenting insights also ensures that the uncovered knowledge becomes part of your organization’s toolkit.
- Real-time, accurate data from a manufacturing ERP makes RCA far more effective. Clear visibility into inventory, production, and quality lets teams identify causes quickly, verify solutions, and even prevent issues before they escalate.
Frequently asked questions (FAQ)
There’s no universal “best” tool for RCA – it depends on the complexity of the issue. The 5 Whys works well for straightforward cause-and-effect problems. Fishbone diagrams help map multifactor issues. Safety-critical or multi-path failures often require Fault Tree or Barrier Analysis. The right tool for the job is the one that fits the structure and severity of the problem being investigated.
Start with a clear problem statement, then ask why the problem occurred. Take that answer, ask why again, and continue until you reach the underlying cause that no longer traces back to another meaningful “why.” For example: “Production stopped.” Why? The machine overheated. Why? The cooling system wasn’t functioning. Why? The filter was clogged. Why? The maintenance schedule wasn’t followed. Why? There’s no clear accountability. Root cause: undefined ownership of preventive maintenance tasks.
RCA forces teams to examine processes objectively rather than relying on assumptions or quick fixes. It uncovers systemic issues that would keep generating failures if left alone. The outcome is a more durable process design, less rework, and more predictable outcomes. Over time, organizations develop stronger analytical skills and a culture focused on prevention instead of reaction.
Teams often stop too early and mistake symptoms for causes, leading to solutions that don’t stick. Other common issues include blaming individuals instead of examining processes, skipping data collection, overcomplicating simple problems, or failing to validate proposed causes. Another frequent gap is poor follow-through, where solutions are implemented but never monitored, leaving organizations unsure whether the fix was effective.
You may also like: The 8 Wastes of Lean Manufacturing