OEE – What is Overall Equipment Effectiveness and How to Leverage It
Your equipment is running. Your team is working hard. But for some reason, production numbers don’t match what the specs promised. Overall Equipment Effectiveness (OEE) solves this puzzle by measuring the true productivity of your manufacturing equipment.
What is Overall Equipment Effectiveness (OEE)?
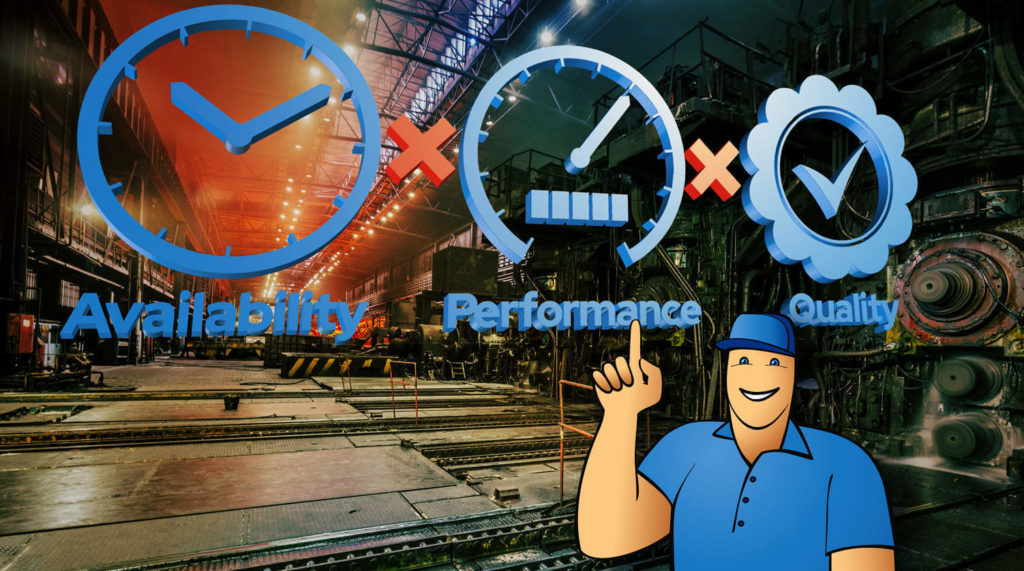
Overall Equipment Effectiveness is a key manufacturing KPI (Key Performance Indicator) that measures and gauges how efficiently a machine or production line is working as opposed to its maximum potential. The KPI relies on three metrics to calculate: availability, performance, and quality. The formula is simple:
OEE = Availability × Performance × Quality.
We’ll look at these components (also called pillars) and how they’re determined in a minute.
Calculating OEE is invaluable because it shows the gap between the theoretical output of a machine and its actual output. It helps determine where bottlenecks or inefficiencies exist in your production lines. OEE is often used in conjunction with capacity utilization calculations to develop initiatives to improve OEE in your manufacturing process and increase your profitability.
What is a good OEE score?
An OEE score, expressed in percentage, of 100% would seem a dream come true. However, that score is unrealistic and really unachievable. In many cases, the score is very dependent on the type of industry you’re in. Here are some standard OEE benchmarks to consider.
- An OEE of 85% or higher is considered world-class in manufacturing. Only top performers reach this level.
- 60-85% is typical for many manufacturers and is a pretty respectable score.
- A 40-60% OEE is considered a below-average score, indicating significant room for improvement.
- An OEE below 40% indicates that you have significant efficiency issues that must be addressed immediately.
As mentioned, the fact is that a good OEE score is highly dependent on the industry standards it adheres to and how it operates. For example, in discrete manufacturing such as automotive, electronics, and furniture, a higher OEE score of 85% and above is quite achievable and even expected. These industries create individual, countable components or products, hence the name “discrete” for that type of manufacturing. Additionally, automation is highly prevalent in these industries, dialing out much of the human factor.
Process manufacturing is different as it usually produces products in bulk quantities. They are measured rather than counted, with a few notable exceptions. Some representative industries are food & beverage, chemicals, pharmaceuticals, and paper. 75-80% is a respectable OEE score because of the cleaning requirements, batch changeovers, and regulatory compliance requirements.
Similarly, high-mix, low-volume operations will inherently have lower OEE percentages of around 60% because of routine, fairly constant changeovers and slow cycles. This will become clearer when we discuss the factors that go into calculating the KPI.
Finally, continuous operations that run 24/7 should aim for and target 85% or more since they are maximizing capacity utilization.
The best OEE score is really the one that’s improving over time, relative to your baseline. In reality, a 5% increase can have a significant impact on your operations. Applying continuous improvement practices is more valuable than aiming for an arbitrary “world-class” number without taking into account the constraints and challenges built into your industry.
The pillars of OEE
Let’s take a closer look at the three pillars that make up the OEE KPI individually.
Availability – was the machine ready to run?
Simply defined, the availability score measures the percentage of scheduled production time during which the equipment was actually running and able to produce product. In other words, when you needed it to run, was it running? This will determine availability losses.
This can be determined using one of two calculations:
Availability = Run time ÷ Planned Production Time
Or more precisely,
Availability = (Planned Production Time – Downtime) ÷ Planned Production Time
One of the main contributors to availability is planned downtime or setup and adjustment tasks. These can include (some depending on the type of operations):
- Changeovers between product types.
- Tooling changes.
- Adjustments and calibrations during a run.
- Scheduled cleaning (often in food processing).
- Warm-up time (a big factor in package sealing and shrink-wrap operations).
Unplanned downtime, aka equipment failures, can also be factored in. Breakdowns and mechanical failures, electrical issues, hydraulic and pneumatic problems, and unexpected equipment failures that require repair are some of the usual culprits.
Performance – how fast did it run?
The performance factor measures how fast the machine or line was running as compared to the theoretical ideal or designed production speed. Here again, we have two formulas for calculating performance.
Performance = (Ideal Cycle Time × Total Count) ÷ Run Time
Or,
Performance = Actual Output ÷ Theoretical Maximum Output During Run Time
It’s essential to note that this number is based on actual production output, excluding product quality considerations. It includes all pieces produced, both good and defective. You’re measuring equipment speed, and that is all. However, this is a bit of controversy in the manufacturing community. Determining what number to use can also be tricky.
Often, manufacturers use one of three options to determine the “maximum” speed. Some use the nameplate or design speed. Others use a “proven maximum”, i.e., the fastest documented speed achieved. Still others use the speed they maintained for a full shift without quality issues. That’s more realistic, but giving the lowest performance expectations can also risk skewing your calculations. I might suggest one of the first two options, but whatever you choose, be consistent.
Quality – how many were good?
While performance didn’t take defects into account, the quality metric does. The question you’ll be asking is, how much of everything that was made is actually usable? Most of the time, quality losses fall into two categories:
- Process defects are those that happen during production. These are the parts that fail inspection or may be discovered during production. They may include dimensional errors, surface finish errors, or assembly problems, such as in furniture manufacturing.
- Startup losses are those that occur before production gets into full swing. For example, the first pieces after a changeover might not meet spec. These first pieces are often used to dial in calibration and are test pieces. Or, sometimes, when heat is part of the process, the equipment may not have warmed up enough for the first few pieces, such as in bag sealing.
The Six Big Losses – where efficiency actually disappears
The Six Big Losses framework breaks down OEE into specific, actionable loss categories. Think of them as the “usual suspects” when production efficiency goes missing. Understanding which of these six is hitting you hardest tells you exactly where to focus improvement efforts.
The six big losses are equipment failure, setup and adjustments, idling and minor stops, reduced speed, process defects, and reduced yield. They are mapped to the three OEE pillars as follows:
| Availability (downtime): | 1. Equipment failure 2. Set up and adjustment |
| Performance (speed): | 3. Idling and minor adjustment 4. Reduced speed of operation |
| Quality (defects): | 5. Process defects (scrap, repairs) 6. Reduced yield (from start-up to stable production) |
The reason for mapping these losses is simple – you need to know where to put your efforts into improvements and whether they will make a big enough impact on your OEE.
After working years in processing machine maintenance, I can tell you for a fact that the leading cause of equipment failure is inadequate preventive maintenance.
Some companies think they can’t afford to schedule downtime for preventive maintenance. Those are the companies that spend even more time and money on emergency repairs that could have been avoided.
Setup and adjustment are, to some extent, built-in time stealers – there’s no way around them. For example, a tooling change on a CNC machine takes time, as does changing dies on a stamping press. But, using the same strategies used in increasing capacity utilization, such as lean manufacturing processes like SMED (Single-minute Exchange of Dies), you can cut that time down.

Calculating Overall Equipment Effectiveness
Now that you know the basics of the different components, let’s put this in a real-world example. But first, a hard truth. You must get accurate data to get accurate results. Let’s start with a simple calculation scenario.
Basic OEE example
Your company manufactures widgets. Your machine can theoretically spit out 100 widgets per shift. But it was only available 90 percent of the time. During that shift, it only ran at 80% of its designed speed. When inspected, only 95% of the widgets were good, with 5% defects needing rework or hitting the scrap pile.
Therefore, your formula is: 90% × 80% × 95% = 68.4% OEE.
That means you managed to produce 68 good widgets out of a theoretical 100 widgets per production shift. The other 32 widgets were lost, possibly due to downtime, slow speeds, or defects.
Real-World OEE example
As you might guess, not every OEE calculation is as simple as that. When you add in the three pillars and the potential six big losses, things can get complex. Let’s lay out a scenario that’s more accurate for real manufacturing.
Let’s say you’re running a 10-hour production shift. That means your potential production time is 600 minutes. You have a scheduled break that runs 30 minutes, making your total planned production time 570 minutes.
Availability calculation
During the shift, you had several interruptions. The setup at shift start was 45 minutes. There was an unplanned breakdown, maybe a motor issue, for 30 minutes. Minor adjustments throughout the shift resulted in 6 stops of 5 minutes each, a total of 30 minutes
All those interruptions added up to 105 minutes of downtime. That means your total actual runtime (uptime) dropped from 570 to 465 minutes. So your availability calculation is Runtime (465 minutes) divided by Planned time (570 minutes), which equals 81.6%. In other words, you lost nearly a fifth of your runtime to stoppages.
Performance calculation
Now you need to calculate how fast your equipment was running. Remember, we’re just using total output here. According to design specs, the ideal cycle time is 2.0 minutes. That means you could potentially produce 232.5 units in your 465-minute uptime. However, a total of 204 parts were produced. Your performance calculation looks like this:
Performance = (Ideal Cycle Time × Total Count) ÷ Run Time
Performance = (2.0 × 204) ÷ 465 = 408 ÷ 465 = 87.7%
So, your machine ran 12% slower than its design speed, possibly due to one or more reasons. Finding the reasons may require a root cause analysis.
Quality calculation
The last factor to analyze is the quality calculation. Here is where you find out if products meet your quality standards. Let’s say of the 204 units produced, 196 passed quality control inspection, while 8 parts had defects or needed rework. Here’s the math:
Quality = Good Parts ÷ Total Parts
Quality = 196 ÷ 204 = 96.1%
Putting it together – the OEE calculation
Now it’s time to put the pieces together and do the OEE calculation with your results.
OEE = Availability × Performance × Quality
OEE = 81.6% × 87.7% × 96.1% = 68.8%
So, what does that 68.8% really mean? It likely means you have some work to do. While you had a theoretical capacity of 285 good parts, your production process yielded 196 good parts. This comes out to 68% of your theoretical capacity.
To put it another way, you lost a total of 31.2% capacity to one or more of the Six Big Losses. While it’s not overly damaging (in fact, it’s rather typical for many manufacturing operations), there is plenty of room for improvement. Now is the time to perform a root cause analysis to pinpoint the problems and come up with some solutions. You won’t solve them all at once. But incremental improvements will make a difference and are easier to implement and track.
OEE vs TEEP
TEEP or Total Effective Equipment Performance is another workstation efficiency KPI closely related to OEE. Their difference can be summed up in one sentence: OEE measures how effectively you use your scheduled production time, whereas TEEP measures how effectively you use ALL the time you COULD be producing.
So to put it simply, OEE is calculated on planned production time, while TEEP takes into account all available time – 24 hours a day, 7 days a week, and the complete calendar year, including holidays and weekends.
Why is that relevant? TEEP helps to uncover potential capacity utilization increases. This number is used to inform strategic decisions such as increased shifts or investing in new and additional equipment. That said, there may be a point where adding capacity is counterproductive and may be less of an asset than a liability.
The formula is:
TEEP = OEE × (Planned Production Time ÷ Total Available Time)
The importance and challenges of tracking OEE
Tracking OEE is important for any manufacturer. It serves as a way of improving production, often gaining capacity without an excessive expenditure of capital. But it’s not without its challenges. There are times when someone “cooked the books” to make the numbers look better. That does nothing to help the business’s bottom line.
Here’s a common scenario that happens way too often. A manufacturing management team gets excited about measuring its OEE. They implement the proper tracking solution, like an MRP system, and then they discover their OEE is terrible. The management team panics at the numbers, and someone ‘adjusts’ how the calculation is made. The OEE looks much better, and everyone breathes a sigh of relief.
But nothing actually improves. Here’s how tracking OEE can go wrong.
- The numbers game: Facilities often start manipulating OEE within months of tracking it. They redefine “planned production time” to exclude inconvenient downtime. They set unrealistically low ideal cycle times, so performance looks better. They don’t count rework as defects. Why? Because bad numbers are embarrassing, and nobody wants to report 58% OEE to executives.
- The cost: You can’t improve what you won’t honestly measure.
- The blame trap: The fastest way to kill OEE tracking is by using it to punish people. Post shift rankings. Tie bonuses to OEE. Publicly call out “underperformers.” Watch what happens: Operators stop reporting downtime. “Adjustments” get called “planned maintenance.” Quality issues disappear from paperwork but show up with customers.
- The cost: People game the numbers instead of fixing problems.
- The data quality disaster: Manual tracking sheets. Operators logging downtime from memory at shift end. No verification of numbers. Downtime reasons are missing or wrong. This creates beautiful dashboards built on garbage data and leads to terrible decisions.
- The cost: You’re confidently wrong instead of roughly correct.
- The “track but don’t act” problem: Facilities spend thousands of dollars on OEE tracking systems. Generate impressive reports. Hold monthly review meetings. Then nothing changes. Problems get identified but never fixed. Data gets collected but never drives decisions.
- The cost: Wasted effort with zero return.
Tips for increasing equipment effectiveness
First, remember to take into account the industry standards you’re working in before getting too worried and choosing a viable target. Here are some tips for improving, no matter what your business manufactures.
Also, bear in mind that your initial numbers matter when it comes to finding the solutions. A facility with a 55% OEE has different challenges than one with an OEE of 78%. Begin by focusing on where you really are. And remember that OEE percentages above 95% are probably bogus, if not downright fabricated.
If your OEE metric is below 60%, focus on the obvious
At OEE percentages below 60%, the problem is likely staring you right in the face. That’s not uncommon. Often, small things happen that get forgotten or swept under the rug because they seem unimportant. I’ve seen this dozens of times in my 36+ years of experience.
I’d recommend starting with evaluating and fixing equipment reliability issues and implementing a basic, yet thorough preventive maintenance schedule. Make sure each machine is running optimally, and you may discover your numbers starting to go up. In fact, you may see your OEE number reach close to 75% by doing this easy step.
If your OEE score is 60-75%, recover the hidden losses
If you’re looking at these values, chances are you’ve gotten your equipment issues fixed and are ready to tackle the hidden losses. Minor stops are the order of the day here. For example, maybe you see brief jams that are cleared quickly before moving on. Eight stops times 30 seconds could be four minutes of lost time per shift. Over the course of a year, that comes up to 13 hours of lost manufacturing productivity, multiplied by the number of workstations where this is happening.
Two other areas for opportunity are changeovers and start-up scrap. Better organization for changeover operations could yield as high as a 30-40% decrease in lost time, often by just organizing the tools more effectively and standardizing the procedure. The best part is that it costs zero money.
If you get a lot of scrap from tuning in your machines at startup, find out why. Check and see how your operators are adjusting their machines. I’m willing to bet that one operator has a system down to minimize scrap. Find out how, document it, and teach it to the others. Again, it costs nothing but the time to find out.
If your OEE is above 75%, optimize and sustain
If your OEE is running about 75%, then you deserve a pat on the back. Your operation is performing better than most companies. But keep up the good work to sustain that effectiveness percentage.
A key here is focusing on consistency. You may have low days and high days. It’s time to look for ways to smooth out those peaks and valleys. Find out what’s different on your best days and see if it can be replicated all the time.
You can also look for ways to run faster without sacrificing quality. Test new line speeds, for example, and document the results. Often, a manufacturing process will run at one speed because it was necessary back in the day. But things have changed, and it’s time to question long-held assumptions.
Regardless of your starting point, do these first
- Get honest baseline data before anything else. Track OEE consistently for at least two weeks. You need your true starting point, not your best day or gut feeling.
- Identify your top three losses by category. Is availability killing you? Performance? Quality? Pick the pillar with the most opportunity and focus there first.
- Track progress monthly with the same calculation methodology. Don’t change definitions to make numbers look better. Bad news in accurate numbers lets you fix problems. Good news in manipulated numbers lets problems compound until they become crises.
- Always remember that consistent, constant action is the key to progress in raising your OEE numbers.
Simplify KPI tracking with manufacturing software
Manual data tracking of the stats you need to perform OEE calculations is difficult, time-consuming, and practically impossible to do accurately. It’s also redundant when manufacturing ERP software can automatically track the numbers for you.
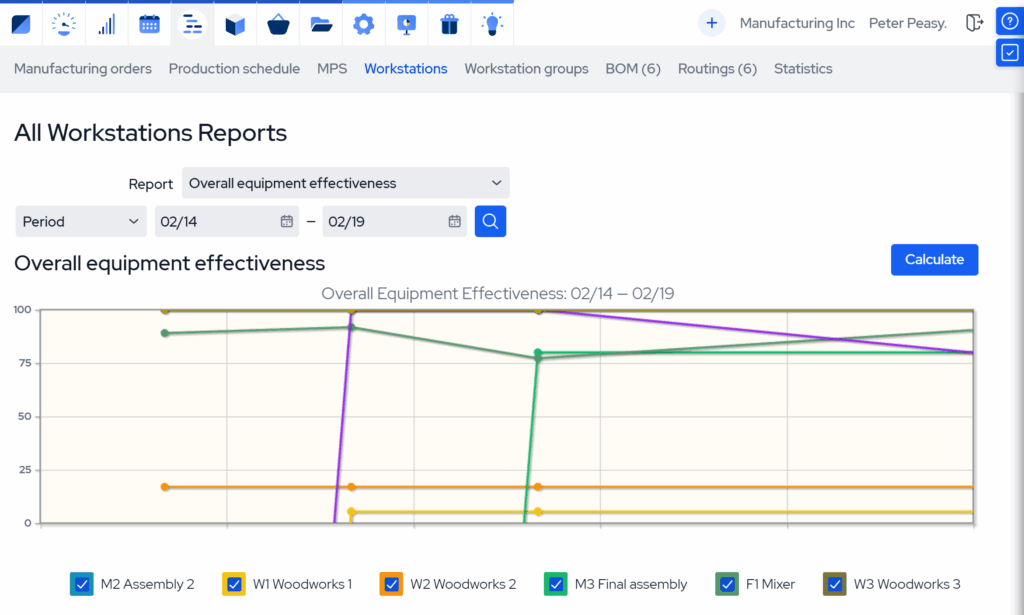
For example, MRPeasy calculates OEE from data already being collected for production management in real time. No separate OEE-specific data entry is required. Operators report production activity once, and OEE calculation happens automatically.
Reports are generated continuously in the background, instead of taking hours to compile. Multiple machines or production lines can be simultaneously tracked, and you have access to both real-time stats as well as per-workstation historical OEE data.
Here’s the bottom line. Software doesn’t improve your OEE. You do. Software just tracks the data faster and more accurately than humanly possible. But then it hands it off to you. So remember, start with the data collection process. Be honest about what you’ve found. Then get busy to make improvements and gauge their effectiveness. Then start all over again. Improving your OEE will raise your profitability. But it’s an ongoing task, improving and sustaining your numbers.
Key takeaways
- Overall Equipment Effectiveness (OEE) is a manufacturing KPI that measures how well equipment performs compared to its full potential by combining availability, performance, and quality into a single score.
- OEE helps manufacturers uncover hidden production losses, identify bottlenecks, and make data-driven improvements that increase throughput without big capital investments.
- A “good” OEE score depends on the industry. World-class manufacturers hit around 85%, while many factories operate respectably between 60–85%. The real target is improvement over your own baseline, not someone else’s benchmark.
- The three pillars of OEE – availability, performance, and quality- help pinpoint different types of production loss, allowing teams to distinguish between downtime, slow-running equipment, and defective output.
- The Six Big Losses framework aligns directly with OEE’s pillars, offering a practical approach to identify and eliminate the most common sources of inefficiency. The losses are equipment failure, setup and adjustment, idling, reduced speed of operation, process defects, and reduced yield.
- Tracking OEE only adds value when data is accurate, definitions are consistent, and results are actually used to drive corrective action rather than manipulate scores or punish employees.
- Manufacturing software like an ERP or MRP system automates OEE calculation and reporting, eliminating manual data collection and freeing teams to focus on improvements rather than spreadsheets.
Frequently asked questions (FAQ)
An 85% OEE score represents world-class efficiency. It means your equipment is running with high availability, near-optimal operating speed, and producing quality output with minimal defects. Very few manufacturers consistently achieve this level.
A good OEE result depends on your industry and production environment. Most factories operate between 60 – 85%, with 85% considered world-class and below 60% usually indicating efficiency problems. But the real benchmark is continuous improvement over your own baseline.
Frequent OEE calculation mistakes include redefining planned production time, ignoring minor stops, excluding rework from scrap counts, and relying on inaccurate manual data logs. These shortcuts distort results and create misleading dashboards, preventing teams from identifying and addressing the real root causes.
Manufacturing software automates data collection, tracks losses in real time, and provides accurate metrics for availability, performance, and quality. It eliminates manual entry errors, highlights bottlenecks faster, and enables informed decisions that directly improve OEE without guessing.
You may also like: Capacity Planning: 10 Essential Steps for Manufacturers